9 Steps to Master Successful Strategy Execution with KPIs
Roger Knocker • April 2, 2024
9 Steps to Master Successful Strategy Execution with KPIs

One cannot overstate the importance of strategy execution in achieving organisational goals.
Executing a strategy in an organization is like running a relay race. The strategy is your race plan. It covers who runs which leg, how you'll do the baton handoffs and the pace you aim to keep. Each runner represents a different part of your organization working towards the common goal. The handoffs are crucial. They mark the shifts in your strategy. Precision and timing are key. Fumbling a handoff can slow down the team or, in the worst-case scenario, cause you to drop the baton and lose ground to competitors. Just as in a relay race, where every runner must know their role, run their hardest, and execute flawless handoffs, every part of an organization must understand their role in the strategy, perform at their best, and ensure smooth transitions to successfully achieve the organisational goals.
9 Steps to Effective Strategy Execution:
Step 1: Identifying Your Core to Enable Strategic Performance
"Stay focused on your core business. The most successful businesses do one thing well and then expand from there." - Jeff BezosIt has become evident that even the strongest of businesses can become unstable or stagnate due to premature abandonment, miscalculation, or overreaching in the search for new growth. Understanding your core business functions is the foundation that every company needs to define if they wish to succeed.
Companies must identify and define the 5 key assets to ensure better strategy execution:
2. The MOST differentiated and strategic capabilities
3. The MOST critical product offerings
4. The MOST important channels
5. Any other contributing critical strategic assets
A company is only as strong as its core, and often most of your growth will come from defining your core. Once you understand your core, you can really get into setting KPIs that benefit your company in its entirety.
"Your core business is your foundation. Everything grows from there. If it's strong, you can build an empire." - Richard Branson
Step 2 Setting Clear Mission, Vision, and Values to Align Your Strategic Objectives.
A set of mission, vision and value statements are invaluable strategic planning tools. Think of these as the personal motivation behind every one of your relay runners (every part of your organisation) you, want your runners to have the right motivations to ensure your desired outcome - Winning! The same counts for the motivation behind your company.
How to write a company Mission Statement:
- Understand Your Core Values and Purpose - Think about what the organisation believes and why it was started in the first place.
- Identify Your Stakeholders - Determine who benefits from your work. Stakeholders include customers, employees, communities, and shareholders. This allows you to understand who you are serving and what you aim to bring to the table.
- Consider What Makes You Unique - Think about what sets your company apart, it might be your unique product offering or the combined industry experience of your team, this becomes your main selling point.
For example: "Our mission is to revolutionize the way people connect with technology, providing innovative and user-friendly products that enhance everyday life. We are committed to delivering exceptional services to our customers, fostering a supportive and dynamic work environment for our employees, ensuring sustainable returns for our shareholders, and adhering to the highest ethical standards in our dealings with government and communities."
How to write a company Vision Statement:
Make sure it includes these six key points: 1. Is it a short crisp sentence?
2. Does it describe the future?
3. Does it create a vivid picture in the listeners’ minds?
4. Is it desirable to your clients?
5. Is It a stretch, but possible?- even if you don’t currently have all the resources to achieve it
6. Can it be measured with Key Performance Indicators (KPIs) or Objectives and Key Results (OKRs)?
Once you've got your vision statement you can craft your strategic vision!
How to Write a Company Value Statement:
followed by a document explaining what each one means. Whatever those values are, they should be ones that the leadership is always
seen to be honouring.
For example:
• Integrity – Doing what is right is more important than profit.
• Frugality – We don’t waste money on unnecessary expenses.
• Teamwork – We work together to deliver services and solutions. No heroes welcome!
• Dedicated – We work hard, play hard but not at the expense of our families.
• Honestly and Accountability - We don’t steal from our customers, colleagues, employees, the state or employers.
• Pride in work – Delivering with excellence makes us feel great
"The companies that are lasting are those that are authentic." Howard Schultz, (the former CEO of Starbucks.)
Step 3: Establishing and Aligning Strategic Goals are the Keys to a Successful Strategic Execution.
Start by setting strategic objectives: short, clear, and inspirational sentences that have a 3 to 5-year time horizon. They are mini-specific goals that describe the end state your company is aiming for. They need to be measurable and actionable for them to drive results.
Setting KPIs to Achieve Your Strategic Objectives
Processes within your company that you need to measure are as follows.
• Quantity
• Quality
• Timeliness
• Efficiency
• Financial Value
By monitoring these KPIs, you can gain insights into your performance across different areas, identify areas for improvement, and make informed decisions to drive growth and efficiency. Not all measurements are KPIs. A KPI is a measure of performance used to check your progress towards a target/ a goal/ a desired state. In this context, each strategic objective becomes the desired state and the KPIs you choose will measure the progress towards each objective.
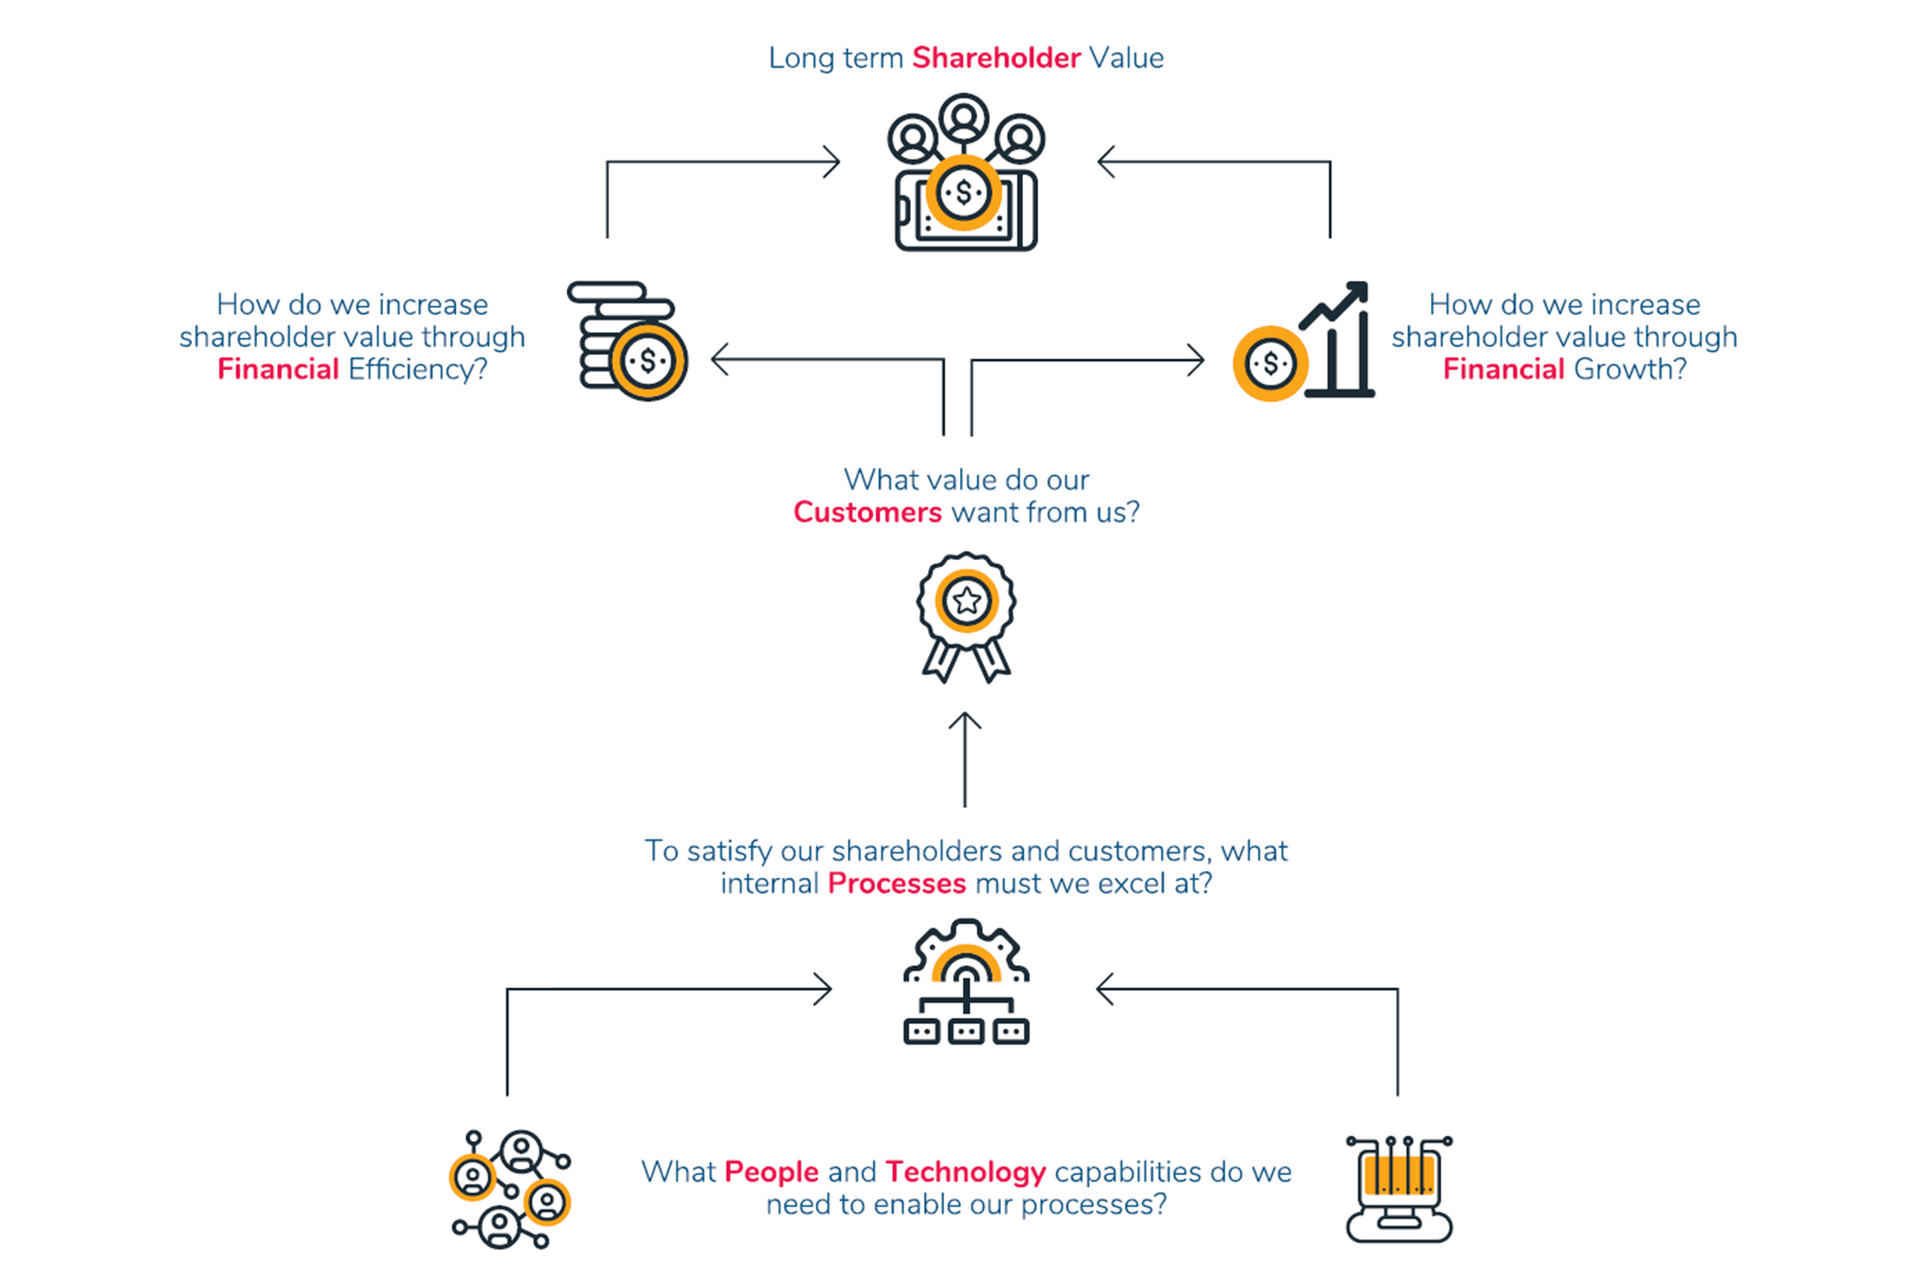
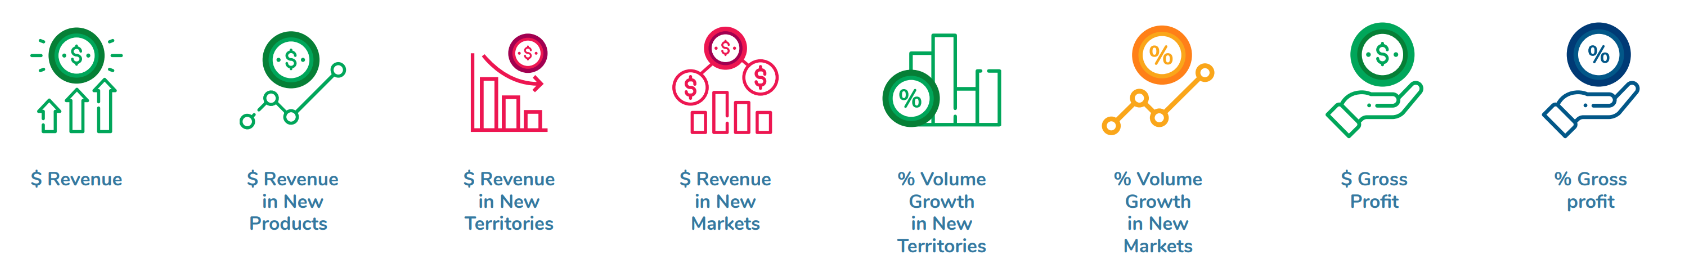
Step4: Financial Goals: Understanding Shareholder Expectations
Strategic Revenue Growth Objectives usually come in one of 5 forms:
1. Organic Growth in Existing Customers by increasing prices or volume through more intense sales or marketing efforts.
2. Growth in New Territories including other provinces, regions or abroad.
3. Growth in New Products - either own or third party.
4. Growth in New Markets using the same processes and products.
5. Growth through acquisitions or mergers
Examples of financial efficiency objectives:
- Maximised Profitability/ Efficient Business/ Unnecessary costs eliminated
- Optimised Working Capital
Effective strategy execution requires clear objectives and Effective Tracking KPIs!
Step 5: Customer Goals: Understanding the Value Your Customers Seek from Your Business to assist in executing your strategy
Think of your customers as the fans of your relay team, asking your fans what they would like to see more off from the team. It is common practice to keep them happy and supportive. Sometimes we forget to take the customer into account and the simplest thing to do is engage them and ask them what they value.
You will typically get three responses:
- Value for Money: Competitive pricing is key, though not necessarily the lowest, but it becomes more critical if there are shortcomings in quality or delivery timelines. In the current climate, consumers are looking for exceptional value—preferring premium products at affordable prices.
- One-Stop Shop: The Customer Solutions model revolves around providing customers with a wide array of tailored products and services, seamlessly integrating into their supply chain. Building strong, on-the-ground relationships is crucial as the focus shifts from offering just products to a more service-oriented mix.
- Product Leadership : Product leadership is about delivering cutting-edge, premium products that stand out not just for their adequacy but for their superior quality and performance. Such products command higher margins to cover the extra costs associated with innovation, research, handling, and branding. Companies need to ground their innovation projects in customer data to avoid diverting resources from activities that are both productive and profitable.
Step 6: Mastering Internal Operations; Key to Satisfying Customers and Shareholders
Optimising the business relies on a key integrated process known as “Sales & Operations Planning” (S&OP) which includes the execution of the
agreed plans.
Here are some examples of value-adding Internal Process Strategic Objectives:
- Forecast more accurately
- Collaborate between sales and operations
- Drive preventative processes proactively
- Adhere to promised due dates
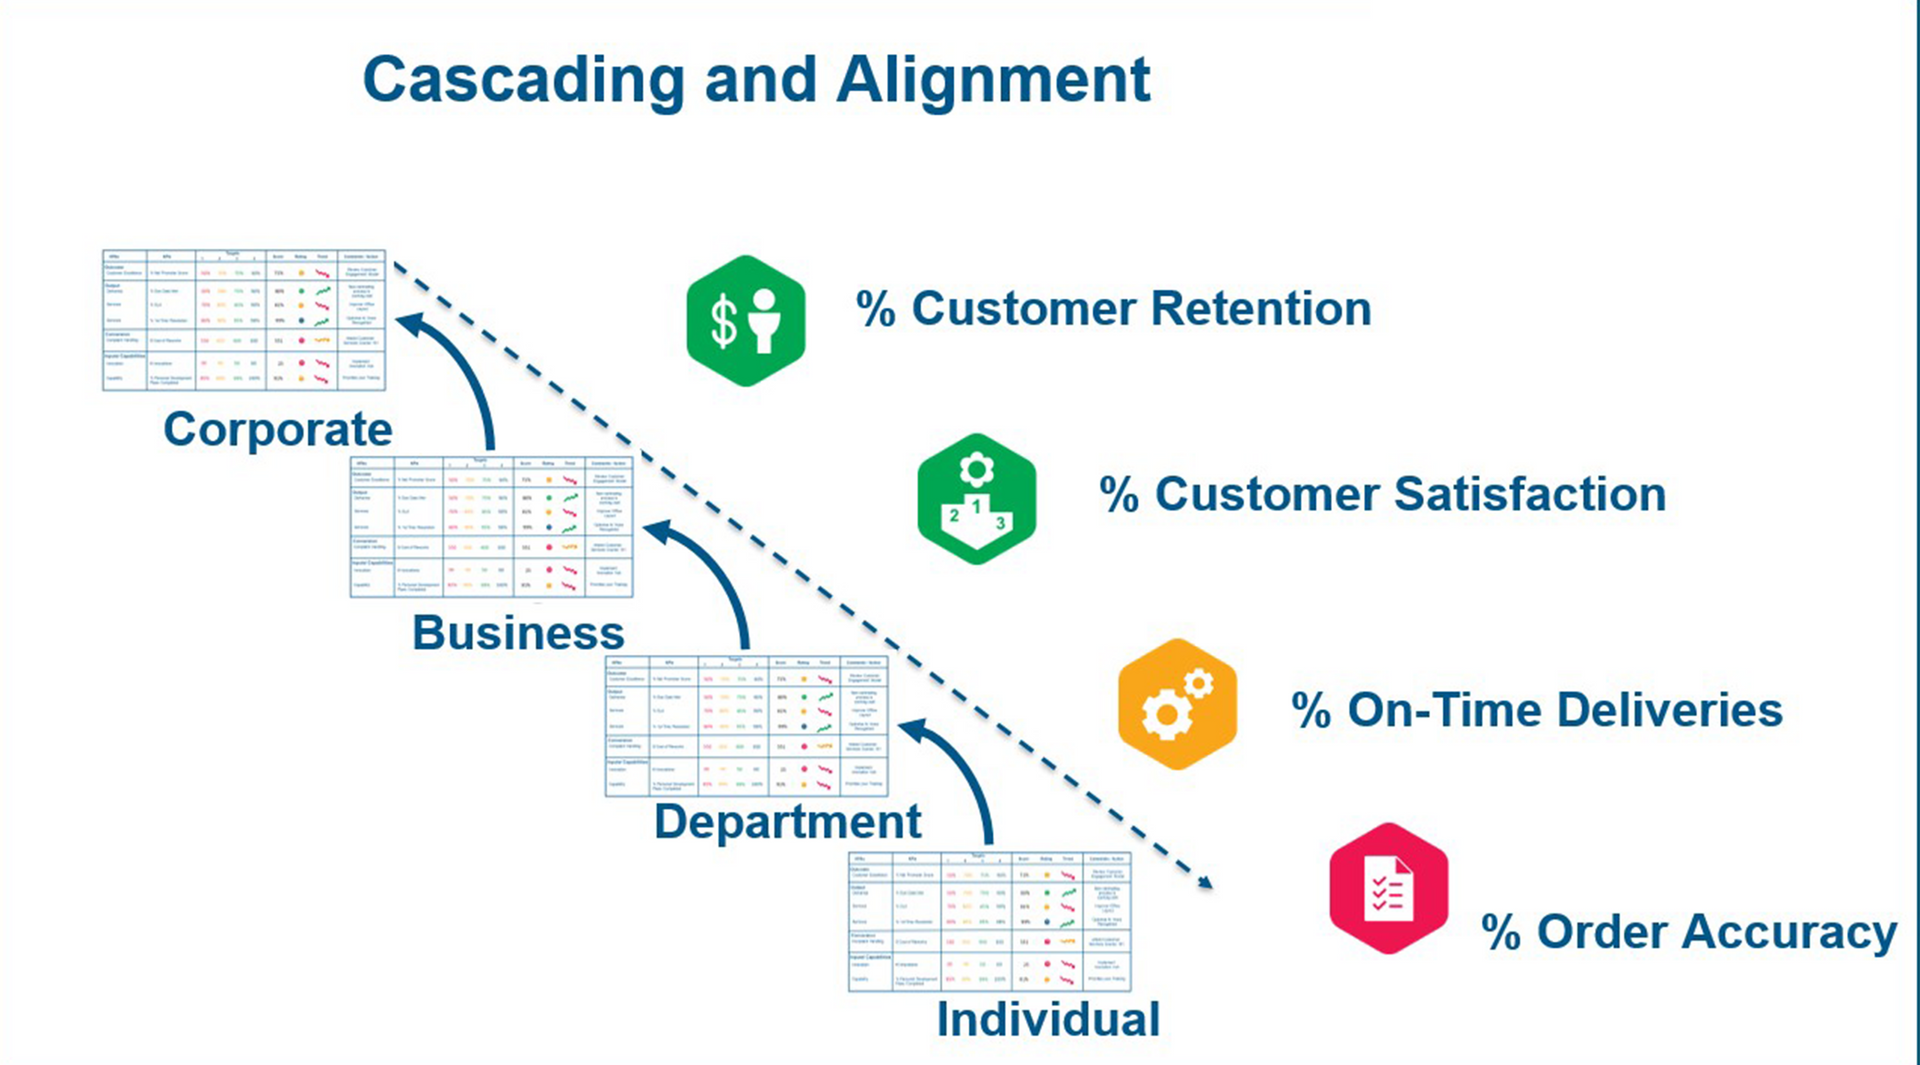
Once strategic objectives for internal processes have been set, they can be cascaded through the organisation at every level, until every individual has a line of sight. These objectives ensure strategic focus across the board.
"Efficiency is doing things right; effectiveness is doing the right things. We achieve both by mastering our internal processes." - Peter Drucker, Peter Drucker is often considered the father of modern management theory. He emphasized the importance of understanding and refining internal business processes to balance efficiency with effectiveness, ultimately driving organisational success.
Step 7: Essential People and Technology Capabilities To Enable Your Processes
Growing people’s capabilities to deliver the business strategy
People are indeed our most important asset, but it's more accurate to say that the focus should be on competent individuals. It's essential for a strategic plan to include the development of your team's capabilities. As the adage goes, 'If you can't measure it, you can't manage it.' Therefore, we advise establishing metrics to assess capabilities at the individual, team, and organisational levels. There is no relay without the runners, right?Drive a strategic performance culture
By integrating insights and principles that foster high performance, and assuring your team understands the strategic objectives of the organisation, your organization can develop a strong culture geared towards peak performance and alignment with its strategic objectives. However, this culture change starts at the top, just like our relay team needs a capable coach, your team needs a committed leader.Align IT systems to the strategy
Information technology has become an integral part of our everyday professional routines. For any process, task, initiative, or strategy to advance effectively, accurate information must be accessible to the appropriate individuals precisely when they need it. Technology offers vast potential not only for automation but also for providing valuable insights into your customers, supply chain, workforce, and financials. Implementing systems that align with your performance management processes will get you one step closer to the successful execution of your organization’s strategic objectives.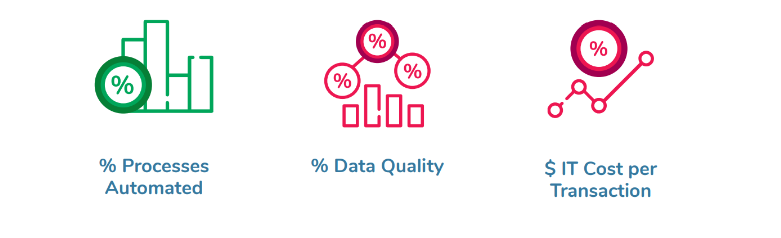
Step 8: Maintain Initiatives Aligned with the Strategic Objectives
Initiatives can encompass projects, action plans, follow-ups, tasks, and any similar endeavors that are either ad-hoc, one-time or occur outside routine processes throughout the organization. These endeavors often account for the bulk of discretionary spending. While many are enthusiastic about launching initiatives, interest can wane when challenges arise, leading to their eventual abandonment. A common pitfall is the lack of proper tracking and measurement, resulting in squandered time, money, and effort. To counter these issues, consider the following strategies:- Initiate as few projects as necessary.
- Ensure each initiative aligns with a specific strategic goal.
- Precisely outline expected outcomes, including the impact on Key Performance Indicators (KPIs) and the extent of this impact.
- Assign clear ownership, budget, and start and end dates for each initiative.
- Regularly measure progress and provide updates, whether weekly or monthly.
Step 9: The Principle of Accountability - What is Measured, Gets Accomplished
We suggest implementing measurements at three distinct levels:
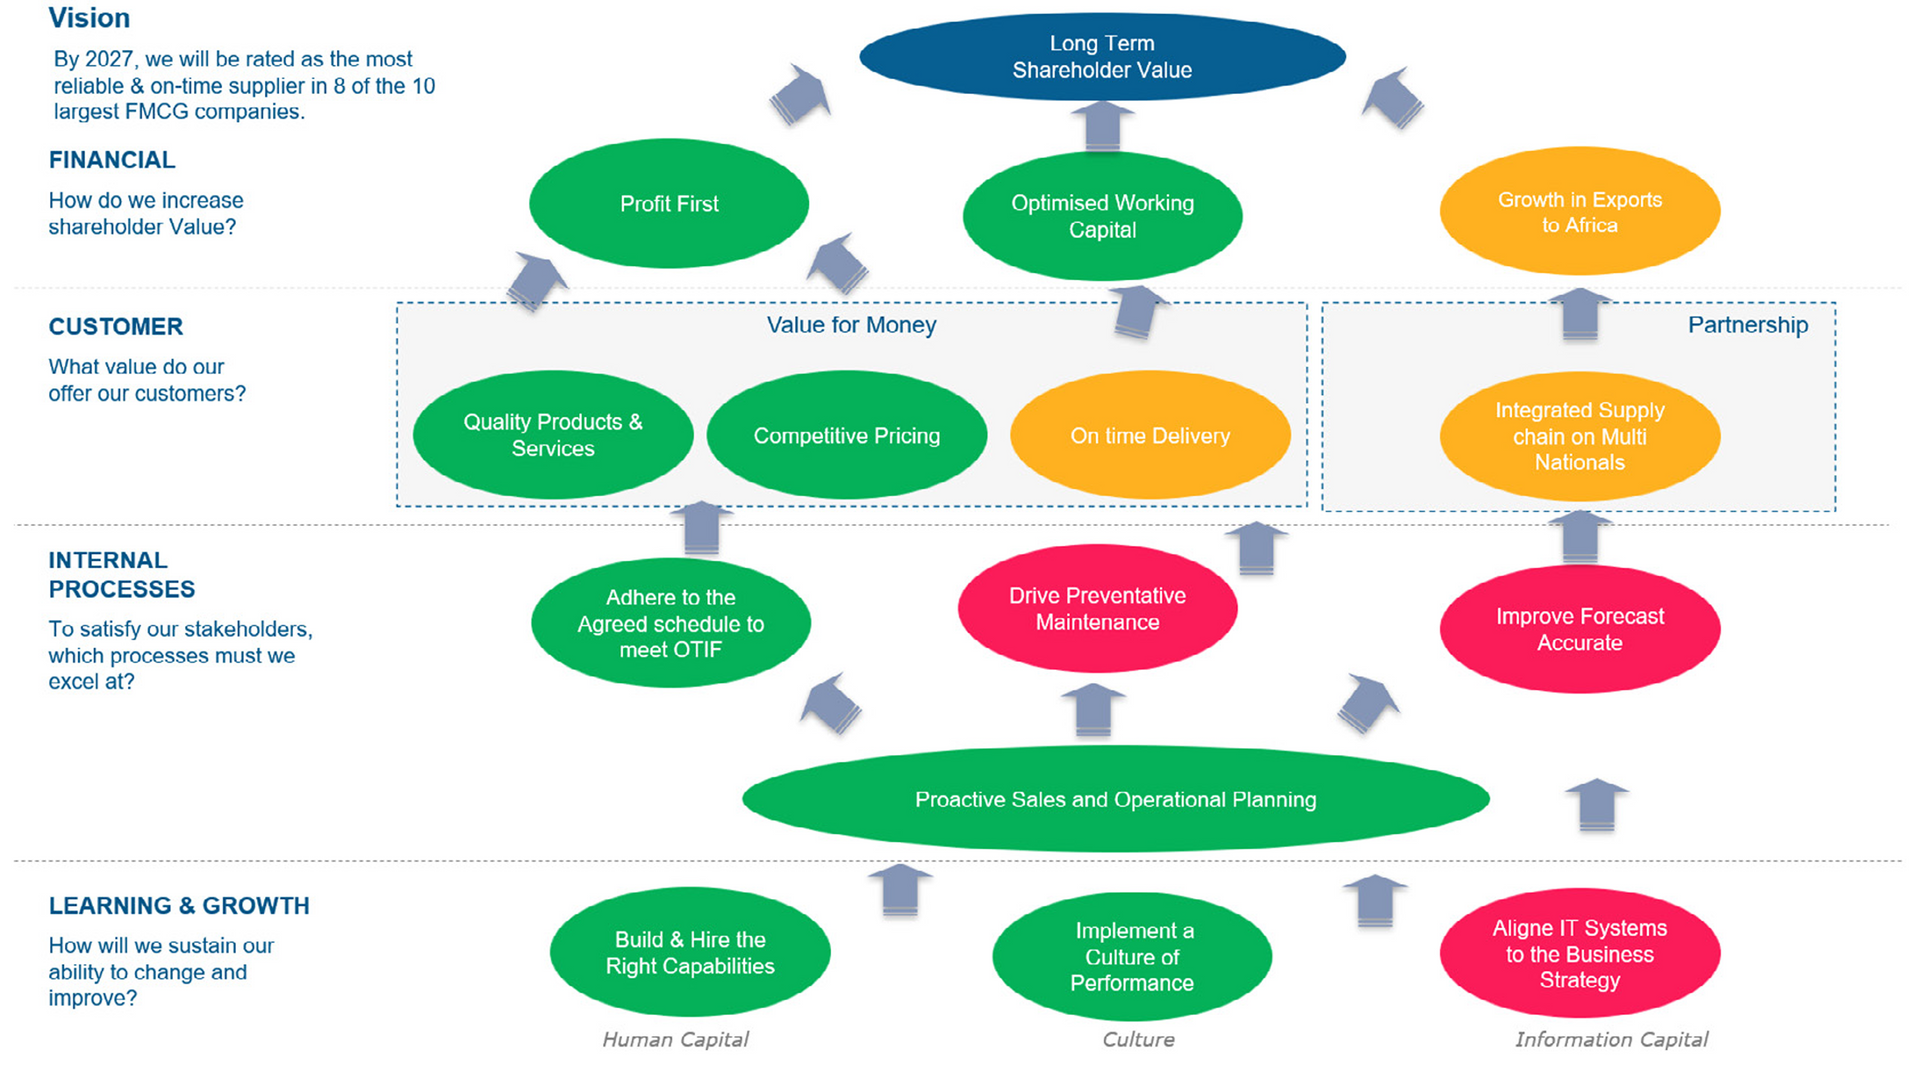
1. Measure the strategy on your strategy map:
At the stage of defining strategic objectives, employing KPIs against set targets can provide clarity. An example would be a strategy map complete with traffic light reporting to indicate status.
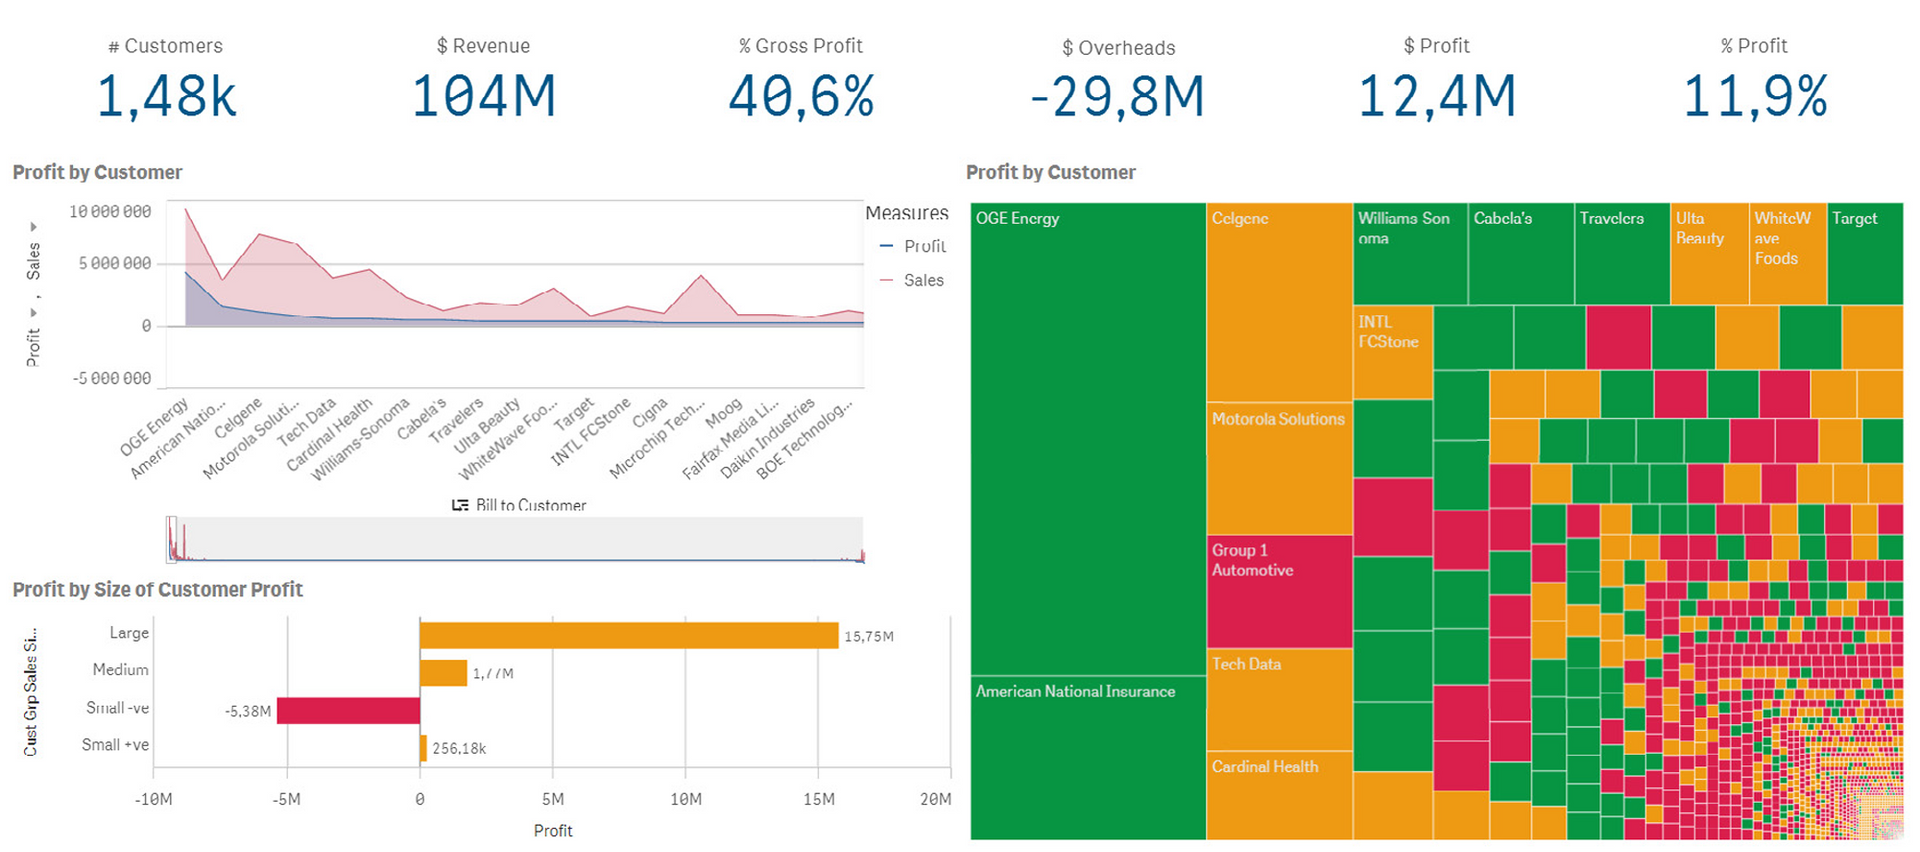
2. Measure the processes with Dashboards
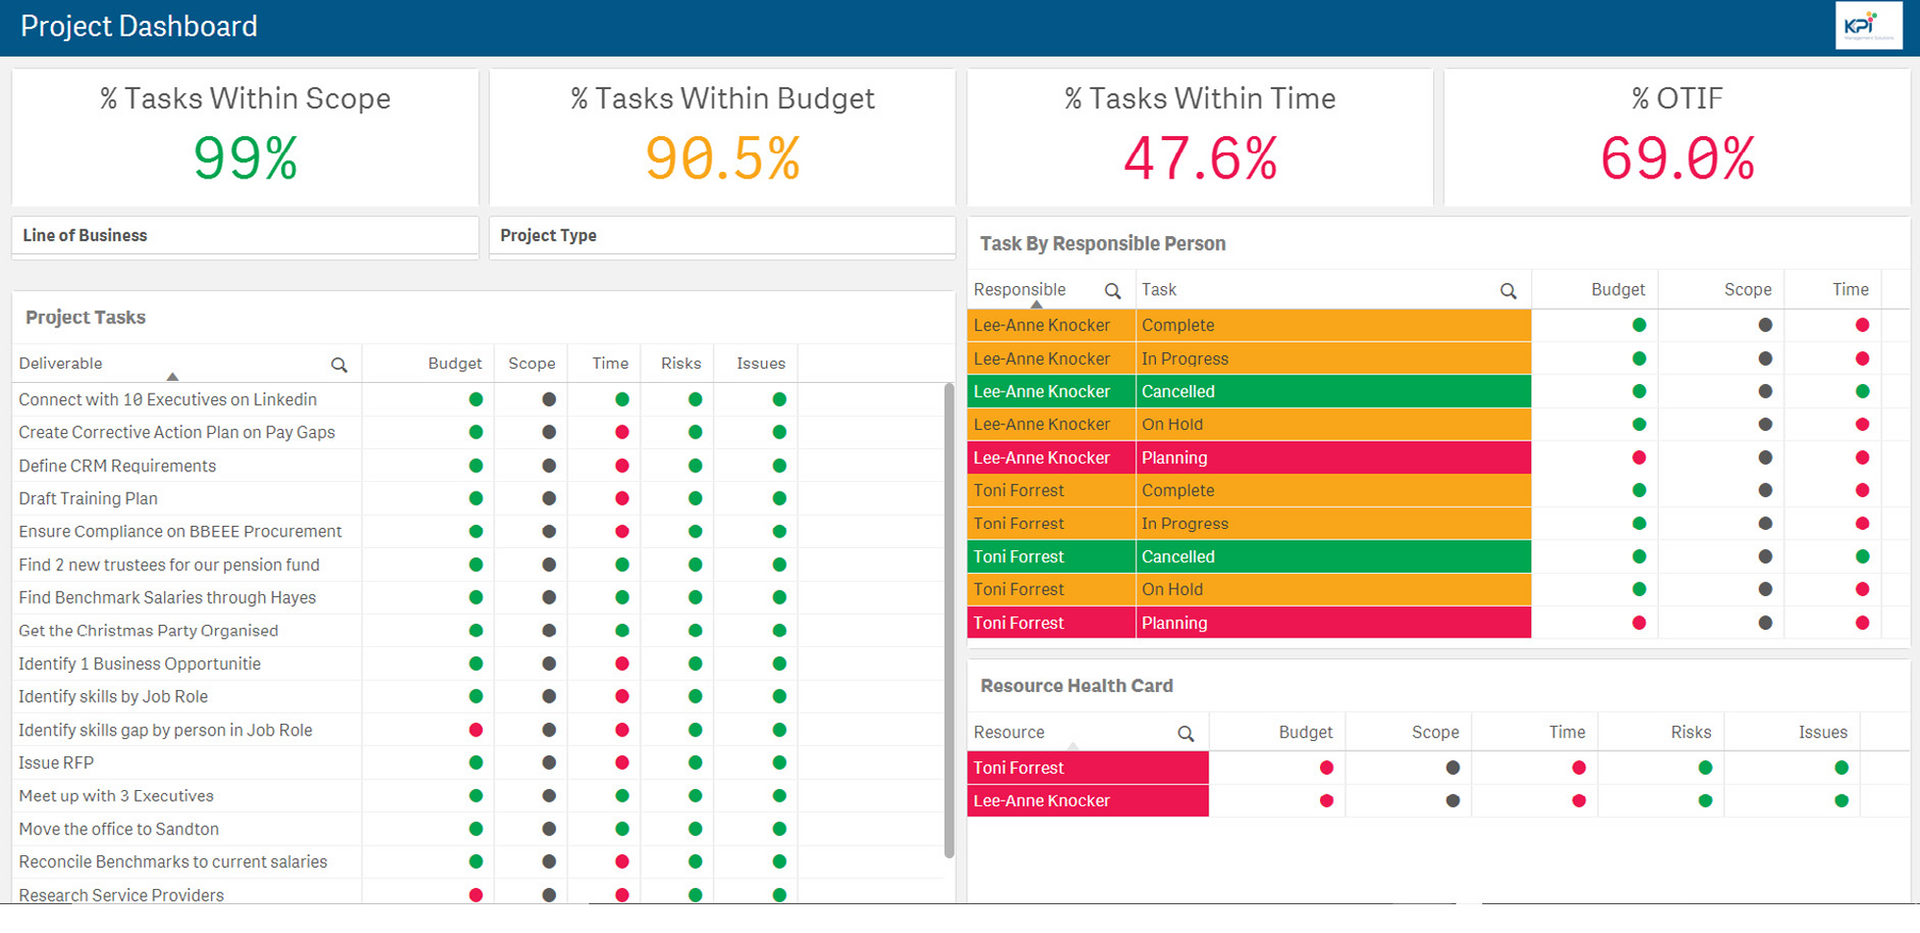
3. Initiatives
Activities from initiatives need to be systemised and tracked like any other process. Dashboards that track individual tasks, responsibilities and due dates work well for this type of data. This is normally with measurable milestones or OKRs.
What about measuring people?
Case Studies - Successful Companies that Follow a Strategic Plan
1. Toyota Motor Corporation
- Strategy Execution: The Toyota Production System (TPS) and quality management.
- Outcome: Toyota's implementation of the TPS, emphasizing efficiency, quality, and continuous improvement, helped the company achieve high levels of productivity and quality. This strategic execution made Toyota synonymous with quality and reliability in the automotive industry, leading to its status as one of the largest car manufacturers globally.
2. Netflix
- Strategy Execution: Transition from DVD rentals to streaming.
- Outcome: Netflix's strategic shift from a DVD rental service to a streaming platform and content creator was a gamble that paid off. By focusing on the growing trend of online streaming and investing heavily in original content, Netflix changed the entertainment industry and became the leading streaming service worldwide.
Conclusions
A company's focus should remain on achieving strategic goals, you do this by measuring your corporate KPIs, without them, your company becomes a relay team without a track.
Feel free to sign up for the KPI spreadsheet to access these and additional KPIs in a structured format that offers better context.
Watch the video below to see what you will get and how to use the KPI spreadsheet to take the guesswork out of KPIs

What one construction disaster taught us about process and why every business needs a CAiSY blueprint.

In the world of finance, numbers tell a story. However, that story is often buried beneath layers of spreadsheets and complex datasets. For financial professionals, the challenge is not just about understanding these numbers but also presenting them in a way that drives decision-making and inspires action. Enter data visualisation – the art of transforming data into clear, compelling visuals. Among the tools that have proven especially powerful are the line graph and the waterfall chart. These visuals help finance teams translate dry statistics into impactful narratives. In this article, we explore how these graphs can transform financial storytelling. The Importance of Data Visualisation in Finance Finance professionals are accustomed to handling vast amounts of data, from profit margins and revenue growth to expense tracking and risk assessments. Yet, presenting these figures effectively to stakeholders is a different ballgame. Visualisation simplifies this process, turning complex data sets into accessible insights. When done correctly, data visualisation: Enhances comprehension: Humans process visuals 60,000 times faster than text, making it easier for stakeholders to grasp key information quickly. Drives decision-making: Clear and compelling visuals help executives make informed decisions without wading through dense reports. Highlights trends and outliers: Visual tools can bring hidden trends and anomalies to light, prompting timely actions. Improves understanding and communication with business - Business doesn't always get what Finance is trying to communicate and good visualisations go a long way to bridging the gap. Better communication improves alignment to strategic financial goals. The line Graph: Unravelling Trends Over Time The line graph, also known as a stream graph or a stacked area graph, is a powerful tool for visualising changes in data over time. It is especially effective in showing how multiple categories contribute to an overall trend. In finance, line graphs can illustrate revenue streams, expense categories, or investment performance in a visually engaging manner. Use Case: Revenue Streams Analysis Imagine a financial report for a company with diverse revenue streams, such as product sales, services, and subscriptions. A line graph can display how each stream has evolved, highlighting peaks and troughs. The thickness of each ‘line’ represents the contribution of that revenue stream to the total, making it easy to spot which areas drive growth. Benefits of line Graphs: Trends Made Simple: Displays how multiple components evolve over time. Visual Impact: The fluid, organic design makes it easier to follow changes. Comparative Insight: Helps compare different categories intuitively. The Waterfall Chart: Bridging the Gap Between Figures Waterfall charts excel at breaking down the cumulative effect of sequential data points, making them ideal for financial analysis. They help bridge the gap between figures by showing how individual elements contribute to a total. Commonly used in profit and loss statements, budget analysis, and variance reports, these charts provide clarity in understanding how specific actions impact the bottom line. Use Case: Profit and Loss Analysis A financial analyst preparing a quarterly report might use a waterfall chart to demonstrate how various factors—like increased sales, higher marketing spend, and cost savings—impacted net profit. The chart’s structure, with its clear progression from starting figures to the final result, makes it easy for stakeholders to follow the financial narrative. Benefits of Waterfall Charts: Clarity: Simplifies complex financial data by showing individual contributions to total figures. Transparency: Clearly distinguishes between positive and negative impacts. Decision Support: Helps executives understand the key drivers of financial performance. Choosing the Right Visual for the Right Data Selecting the appropriate visual tool depends on the story you want to tell: Use line graphs for illustrating trends across multiple categories over time. Opt for waterfall charts when you need to detail the step-by-step impact of specific factors on an overall financial figure. By mastering these tools, finance professionals can enhance their storytelling, transforming raw data into insights that drive strategic decisions. Conclusion: From Data to Decisions The ability to visualise data effectively is a powerful advantage. The line graph and waterfall chart are more than just visual aids—they are essential tools for financial professionals looking to make data-driven decisions that resonate with stakeholders. By adopting these techniques, finance teams can turn numbers into narratives that not only inform but also inspire action. In the end, the power of finance lies not just in analysing data but in presenting it with impact.