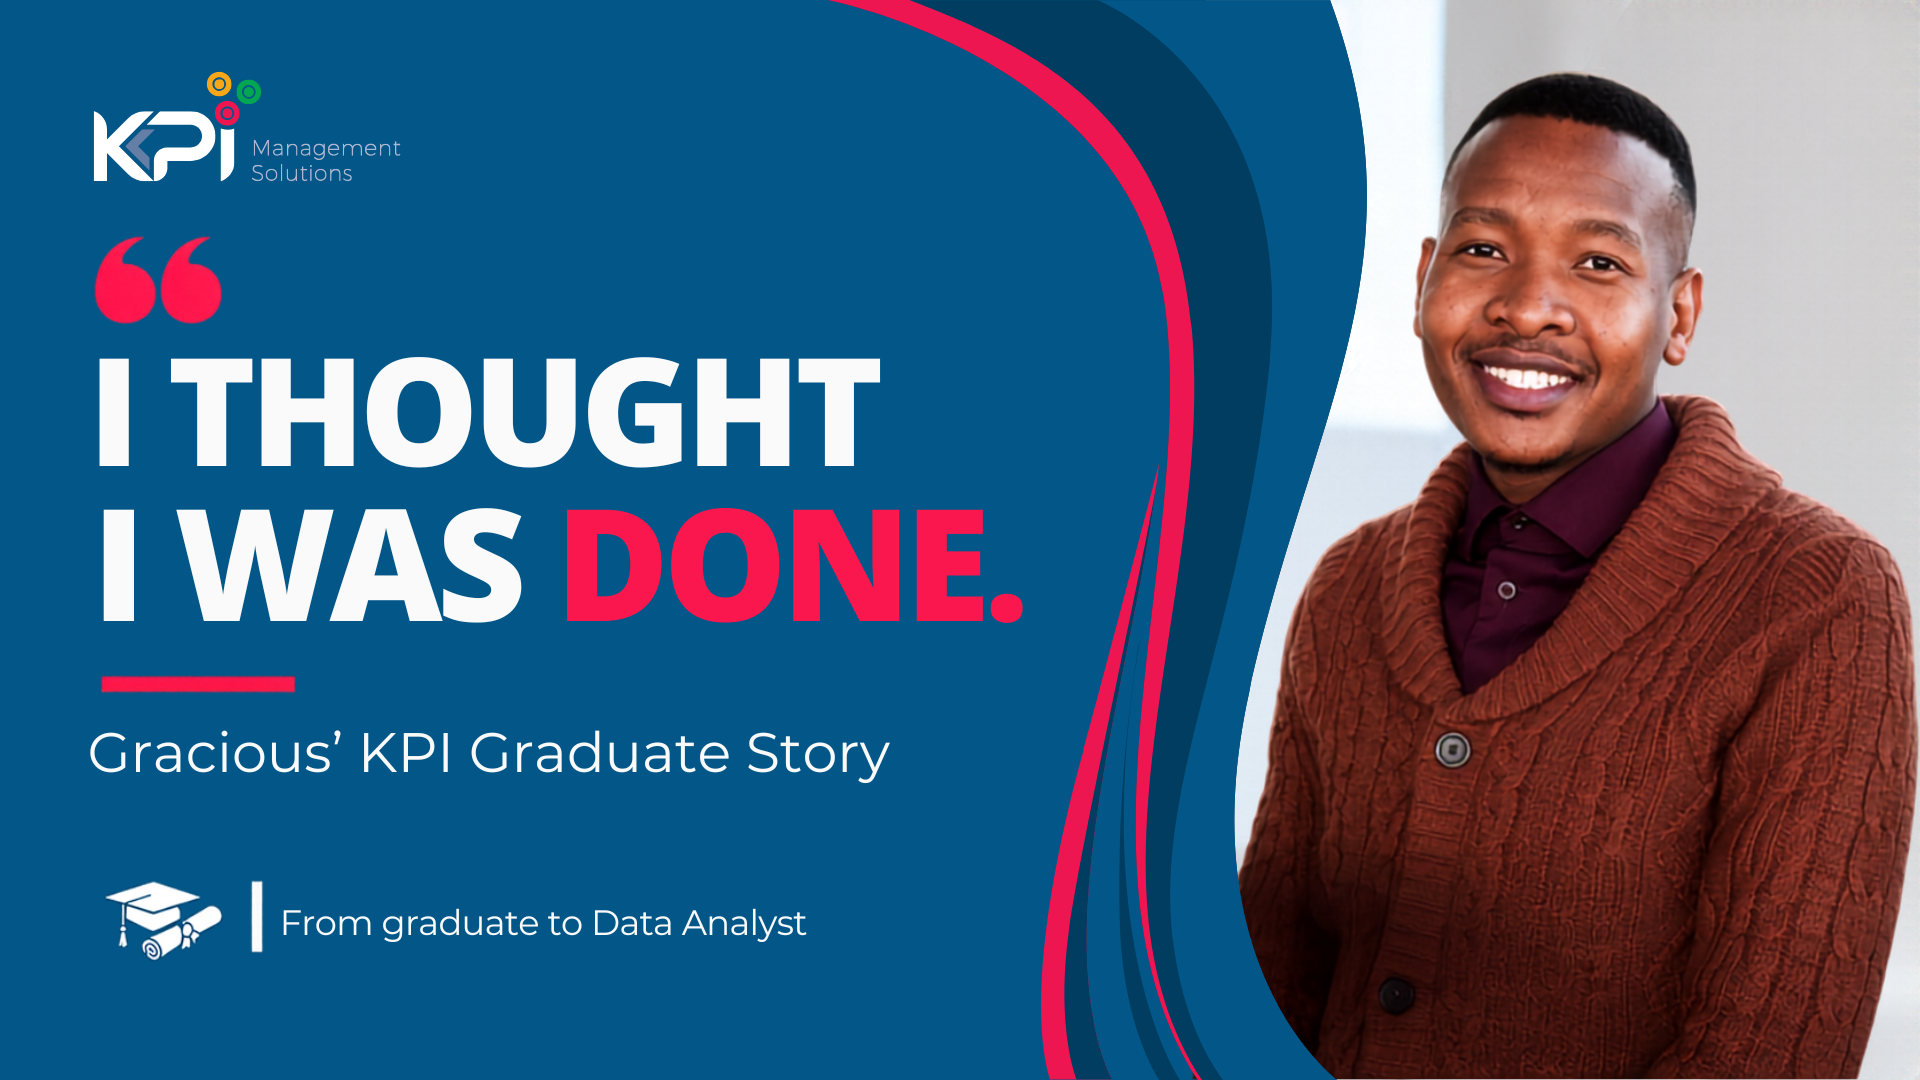
Gracious remembered the excitement of finishing his first data report. He'd done the analysis, built the report and thought the job was complete.
As he put it in his graduation speech:
“Nah, nah, nah, nah.”
There was more to do. He needed to turn the data into a story that someone else could understand and use.
I liked that moment in his speech because it gets to the heart of something I've spent years teaching data analysts.
Knowing how to build a report isn't the same as knowing how to find and communicate the insights within it.
And Gracious's journey through the KPI Graduate Programme showed how much work goes into developing that skill.
It started with a question about the data
Gracious came into the programme with a background in finance, monitoring and evaluation, including entity oversight. He'd always been interested in data analytics.
He recalled one of his earliest assessments, where candidates were given a dataset and asked to answer questions using graphs and other analysis.
But there was an additional question that caught his attention.
If they could find any other useful analysis in the data, they were encouraged to do it.
Gracious took that invitation seriously.
He spent time studying the dataset, understanding what was required and looking for additional findings beyond the questions he'd been given.
That was a good start.
One of the things I look for when developing analysts is whether they're willing to go beyond the immediate task.
It's one thing to answer the question someone has asked you. It's another to look at the information and ask whether there's something else worth investigating.
That willingness to explore is often where useful analysis begins.
Understanding the data before building the report
As Gracious progressed through the programme, he learned that working with data required more than knowing how to use a reporting tool.
He had to understand the datasets he was working with, how different tables related to one another and how to build a model that would produce meaningful information.
This was something he emphasised in his graduation speech.
“You have to understand the data that you're working with.”
It sounds obvious, but I've seen how easily this step gets overlooked.
People can become so focused on producing a dashboard that they don't spend enough time understanding the underlying information.
They start building charts before they're clear about what the data represents, how it fits together or whether the results make sense.
Gracious learned to work through those questions, develop his data modelling skills and build reports that could communicate what he'd found.
But technical skills were only one part of his development.
The value of getting your work challenged
One of the things Gracious spoke about was the amount of feedback he received during the programme.
The graduates regularly presented their work, and those presentations were critiqued.
That isn't always comfortable, particularly when you've spent time building something and think you've done a good job.
But feedback only has value if you do something with it.
Gracious developed a practical habit. After a presentation, he would keep a register of the lessons he'd learned and use it to improve his work before the next session.
He described how he'd improve in one session, then the next, and then the next.
I think that's a useful lesson for anyone starting a career in analytics.
You're not going to get everything right the first time. Your initial model may need reworking. Your report may not answer the business question clearly enough. Someone reviewing your work may spot something you've missed.
The important thing is whether you can take that feedback and make your next version better.
For Gracious, those repeated improvements helped him become more comfortable working with data and presenting his findings.
By graduation, he could confidently say:
“You can throw me any data set.”
That was quite a change from the graduate for whom working with data had been a steep learning curve.
The real work begins when you explain the numbers
I want to come back to that moment when Gracious thought he'd finished his first report.
He'd completed the technical work, but now he had to explain what he'd found.
What was the information telling him? Why did it matter? What could someone do differently as a result?
This is where data analysis becomes genuinely useful to a business.
A report can show that something has changed. It might reveal a movement in costs, sales, volumes or performance.
But the person receiving that report needs to understand the significance of the change.
They need to know whether it's something to investigate, something to act on or simply something to monitor.
That requires the analyst to move beyond presenting information and start explaining it.
It's a skill that takes practice, and it's one of the reasons we place so much emphasis on presenting and discussing analytical work during the programme.
Going further together
Gracious ended his speech by talking about the people who'd shared the experience with him.
He referred to the African proverb:
“If you want to go fast, go alone. If you want to go far, go together.”
Gracious described how, whenever someone struggled, the others would step in to help.
He said it was something they'd taken from our sessions, and I was pleased it stuck.
Data analytics isn't something people do entirely on their own. You need to understand the business, work with different teams, ask questions and learn from people with experience in areas you may not know well.
The ability to collaborate is just as important as knowing how to build a model.
For Gracious and his fellow graduates, learning to support one another was part of preparing for that reality.
From KPI graduate to Data Analyst
After his graduate placement at Absa Group, Gracious continued with KPI Management Solutions as a Data Analyst. In August 2024, he joined Glencore, where he works as a Data Analyst in commodity trading and risk reporting.
It's good to see how his career has developed, particularly when I think about the things he spoke about at graduation.
He'd learned to understand datasets, build models, present his work and use feedback to improve. Those are practical capabilities that remain relevant as analysts move between businesses and industries.
What I took from Gracious's story
When we train data analysts, it's relatively straightforward to assess whether someone can build a dashboard, write a formula or create a data model.
It's harder to assess whether they know what questions to ask and how to explain what they've found.
Gracious started by exploring a dataset beyond the questions he'd been given. He learned to understand and model data, improved his work through repeated feedback and recognised the importance of communicating his analysis to others.
By graduation, he was confident enough to take on unfamiliar datasets.
The report is the starting point. The value comes from what you can help someone understand and do with the information.
That's a lesson I hope more young analysts will carry into their careers.
Watch Gracious's story
Hear Gracious reflect on his experience in the KPI Graduate Programme, the lessons he learned about data analysis and the people who helped him grow.