Why Finance Teams Have a Talent Pipeline Problem (Not a Hiring Problem)

Roger Knocker • August 4, 2026

Why Finance Teams Have a Talent Pipeline Problem (Not a Hiring Problem)

South Africa has world class finance talent. The challenge isn't finding it. It's building enough of it for the future.

By Roger Knocker

August 08 2026 

South Africa produces some of the best chartered accountants in the world, and the world knows it.


Our finance professionals are highly sought after in London, Sydney, Dubai, and many other international markets because the quality of our training is exceptional and the talent is real.


Sometimes I wonder if that's part of the reason we feel so short at home. The better our people become, the more the world wants them.


For more than fifteen years, finance leaders have explained the challenge to me in the same way.

"We can't find the talent."

With only around 48,000 chartered accountants in South Africa and an estimated shortage of more than 20,000 skilled finance professionals, it's easy to understand why that belief exists.


But after watching the same pattern play out for years, I've come to a different conclusion.


The talent isn't the problem.


The pipeline is.

Why Hiring Isn't Solving the Problem

Many organisations still treat finance capability as a recruitment challenge.


A senior finance professional resigns.


HR advertises the position internally for six or eight weeks, even though everyone already knows there isn't an internal successor ready to step into the role.


Eventually, the search moves outside the organisation.


By then, the business has changed, priorities have shifted, and the role often looks very different from the one that was originally advertised.


If you've ever sat in that meeting, you already know how the story ends.

The Hidden Cost of Buying Talent

Buying experienced professionals is expensive.


Research suggests that replacing a senior employee can cost up to one and a half times their annual salary once recruitment costs, lost productivity, onboarding, and the time needed to become fully effective are considered.


External recruitment will always have its place.


There are genuine situations where specialist expertise or fresh perspectives are exactly what a business needs

.

The problem is when buying talent becomes the strategy instead of supporting it.

Build the Pipeline Instead

There's a simpler way.


Build your talent pipeline every day.


The strongest finance teams don't rely on buying finished specialists.


They develop them.


When someone leaves a leadership role, the person below is ready to move up.


That creates another opportunity for the next person to grow.


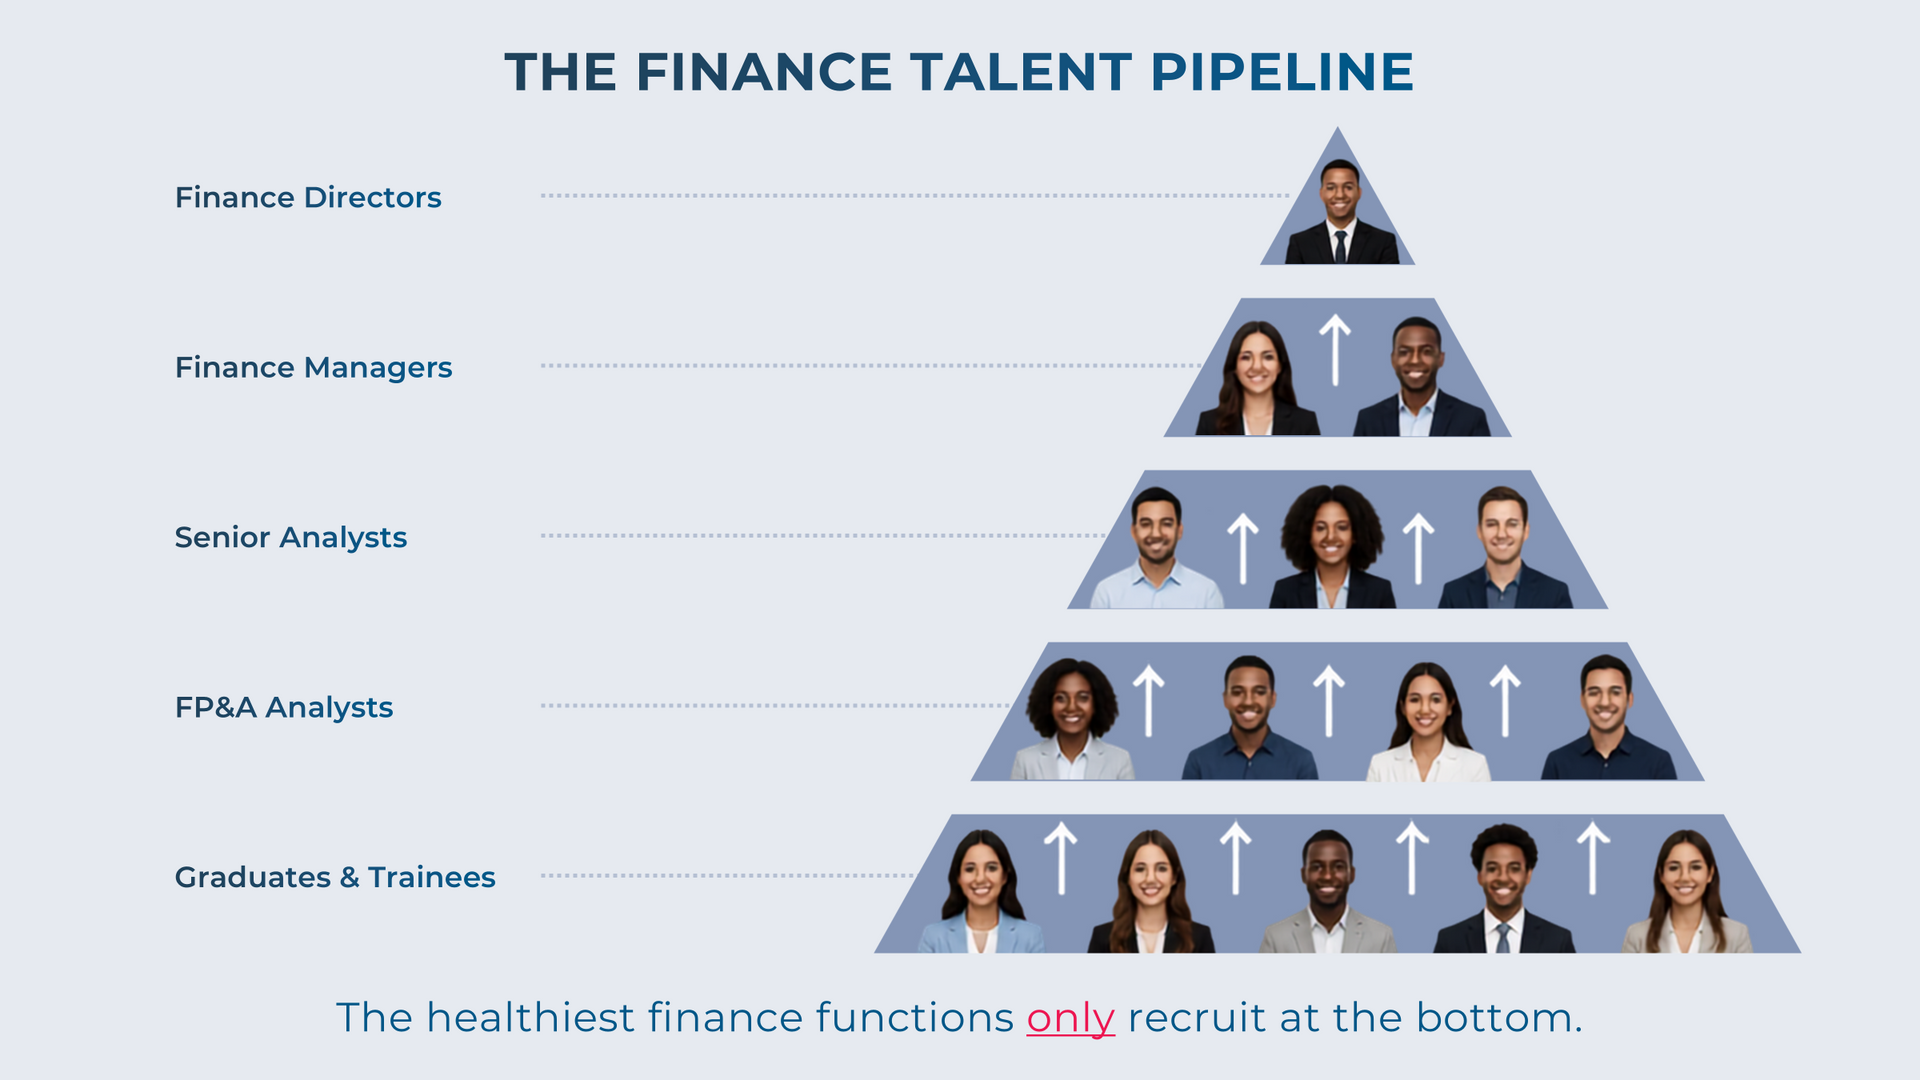
The only position that usually needs to be filled externally is at the bottom of the organisation, where graduates and trainees begin their careers.


That is where talent is most affordable.


More importantly, it is where future finance leaders are developed.

How a Finance Talent Pipeline Works

A healthy finance function creates continuous movement throughout the organisation.

  • Graduates become junior finance professionals.
  • Junior professionals develop into senior specialists.
  • Senior professionals become future leaders.
  • Leadership succession happens naturally because capability has been built over time.


Instead of constantly competing for scarce experienced talent, organisations create their own.


The result is:

  • Lower recruitment costs
  • Stronger succession planning
  • Higher employee retention
  • Greater organisational capability
  • Sustainable long term growth

Key Takeaways

  • South Africa has exceptional finance talent, but global demand remains high.
  • The finance skills shortage is largely a pipeline problem rather than a hiring problem.
  • Building internal capability reduces recruitment costs and succession risk.
  • Graduate programmes create future finance leaders.
  • The strongest finance teams invest continuously in developing people.

Final Thought

When finance teams tell me they have a talent problem, I usually hear something different.

I hear a pipeline problem.

They've spent years buying talent when they could have been building it.

Every finance leader has a choice.

You can continue competing for a limited pool of experienced professionals.

Or you can invest in developing the people who will become tomorrow's finance leaders.

The organisations that consistently outperform aren't simply better at hiring.

They're better at building.

So I'll leave you with one question.

Are you out bidding, outsourcing, or building? And if you're not building yet, what's actually stopping you?

Lessons from a 10-month apartment build gone wrong.
By Janice Wilson November 24, 2025
What one construction disaster taught us about process and why every business needs a CAiSY blueprint.
By Roger Knocker March 18, 2025
In the world of finance, numbers tell a story. However, that story is often buried beneath layers of spreadsheets and complex datasets. For financial professionals, the challenge is not just about understanding these numbers but also presenting them in a way that drives decision-making and inspires action. Enter data visualisation – the art of transforming data into clear, compelling visuals. Among the tools that have proven especially powerful are the line graph and the waterfall chart. These visuals help finance teams translate dry statistics into impactful narratives. In this article, we explore how these graphs can transform financial storytelling. The Importance of Data Visualisation in Finance Finance professionals are accustomed to handling vast amounts of data, from profit margins and revenue growth to expense tracking and risk assessments. Yet, presenting these figures effectively to stakeholders is a different ballgame. Visualisation simplifies this process, turning complex data sets into accessible insights. When done correctly, data visualisation: Enhances comprehension: Humans process visuals 60,000 times faster than text, making it easier for stakeholders to grasp key information quickly. Drives decision-making: Clear and compelling visuals help executives make informed decisions without wading through dense reports. Highlights trends and outliers: Visual tools can bring hidden trends and anomalies to light, prompting timely actions. Improves understanding and communication with business - Business doesn't always get what Finance is trying to communicate and good visualisations go a long way to bridging the gap. Better communication improves alignment to strategic financial goals. The line Graph: Unravelling Trends Over Time The line graph, also known as a stream graph or a stacked area graph, is a powerful tool for visualising changes in data over time. It is especially effective in showing how multiple categories contribute to an overall trend. In finance, line graphs can illustrate revenue streams, expense categories, or investment performance in a visually engaging manner. Use Case: Revenue Streams Analysis Imagine a financial report for a company with diverse revenue streams, such as product sales, services, and subscriptions. A line graph can display how each stream has evolved, highlighting peaks and troughs. The thickness of each ‘line’ represents the contribution of that revenue stream to the total, making it easy to spot which areas drive growth. Benefits of line Graphs: Trends Made Simple: Displays how multiple components evolve over time. Visual Impact: The fluid, organic design makes it easier to follow changes. Comparative Insight: Helps compare different categories intuitively. The Waterfall Chart: Bridging the Gap Between Figures Waterfall charts excel at breaking down the cumulative effect of sequential data points, making them ideal for financial analysis. They help bridge the gap between figures by showing how individual elements contribute to a total. Commonly used in profit and loss statements, budget analysis, and variance reports, these charts provide clarity in understanding how specific actions impact the bottom line. Use Case: Profit and Loss Analysis A financial analyst preparing a quarterly report might use a waterfall chart to demonstrate how various factors—like increased sales, higher marketing spend, and cost savings—impacted net profit. The chart’s structure, with its clear progression from starting figures to the final result, makes it easy for stakeholders to follow the financial narrative. Benefits of Waterfall Charts: Clarity: Simplifies complex financial data by showing individual contributions to total figures. Transparency: Clearly distinguishes between positive and negative impacts. Decision Support: Helps executives understand the key drivers of financial performance. Choosing the Right Visual for the Right Data Selecting the appropriate visual tool depends on the story you want to tell: Use line graphs for illustrating trends across multiple categories over time. Opt for waterfall charts when you need to detail the step-by-step impact of specific factors on an overall financial figure. By mastering these tools, finance professionals can enhance their storytelling, transforming raw data into insights that drive strategic decisions. Conclusion: From Data to Decisions The ability to visualise data effectively is a powerful advantage. The line graph and waterfall chart are more than just visual aids—they are essential tools for financial professionals looking to make data-driven decisions that resonate with stakeholders. By adopting these techniques, finance teams can turn numbers into narratives that not only inform but also inspire action. In the end, the power of finance lies not just in analysing data but in presenting it with impact.
More Posts